

2023Yearly Report
ANNUAL IMPACT REPORT
Download PDF
How we report
This 2023 Impact report was published on March 15, 2024, and covers the financial year from January 1, 2023, to December 31, 2023. This report provides a comprehensive view of Aii’s approach to sustainability and highlights our progress and performance in 2023. Please contact us with any questions about our Impact Report at Impact@apparelimpact.org.


Definitions
Blended Capital
A mix of funding sources, including public, private, or non-profit grants, equity, and debt.
Producer
For Aii, a producer is an umbrella term that refers to stakeholders along the value chain, including mills, manufacturers, farms, and suppliers.
Impact Programs
Aii programs that save actual emissions at the factory level. These programs are applied in the implementation phase of the Climate Action Approach.
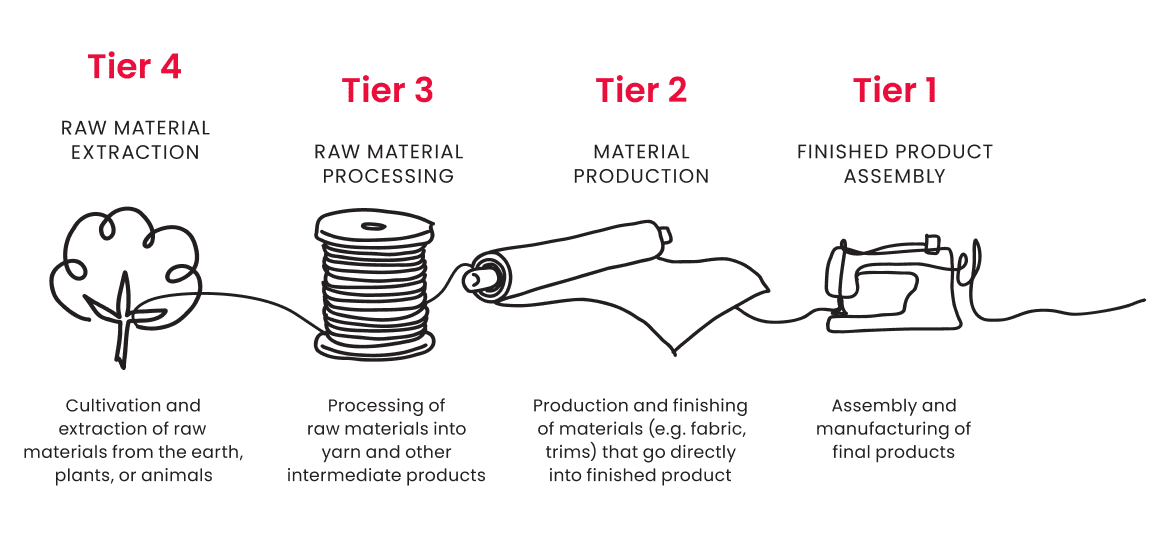
Tiers
Savings - Impact Programs
The type of savings a producer has depends on its program status. Aii therefore divides savings into four different categories:
- 1. Potential savings are based on the full list of potential actions that have been identified at a producer when starting an Aii program. This would be the highest possible value and the other three data points would represent a subset of these actions.
- 2. Forecasted savings are based on a roadmap of interventions that we expect the producer to begin implementing over a multi-year period.
- 3. Projected savings are based on the subset of actions the producer has agreed to and is in the process of implementing.
- 4. Actual savings are based on actions that have been implemented and achieved results. This is measured at the end of the Aii program.
Savings - CSP Solutions
- Forecasted savings are based on the interventions the grantee intends to deliver over the course of the project.
- Actual savings are based on actions that have been implemented and achieved. Results are measured at the end of the solution’s implementation.

Abbreviations
Aii: Apparel Impact Institute
CO₂e: Carbon dioxide equivalent
CSP: Climate Solutions Portfolio
GHG: Greenhouse Gas
GJ: Gigajoule
Gt: Gigatonnes
Mt: Megatonnes = 1 million tonnes
VCI: Value Change Initiative
SOLUTIONS, LEGEND: ¹⁹
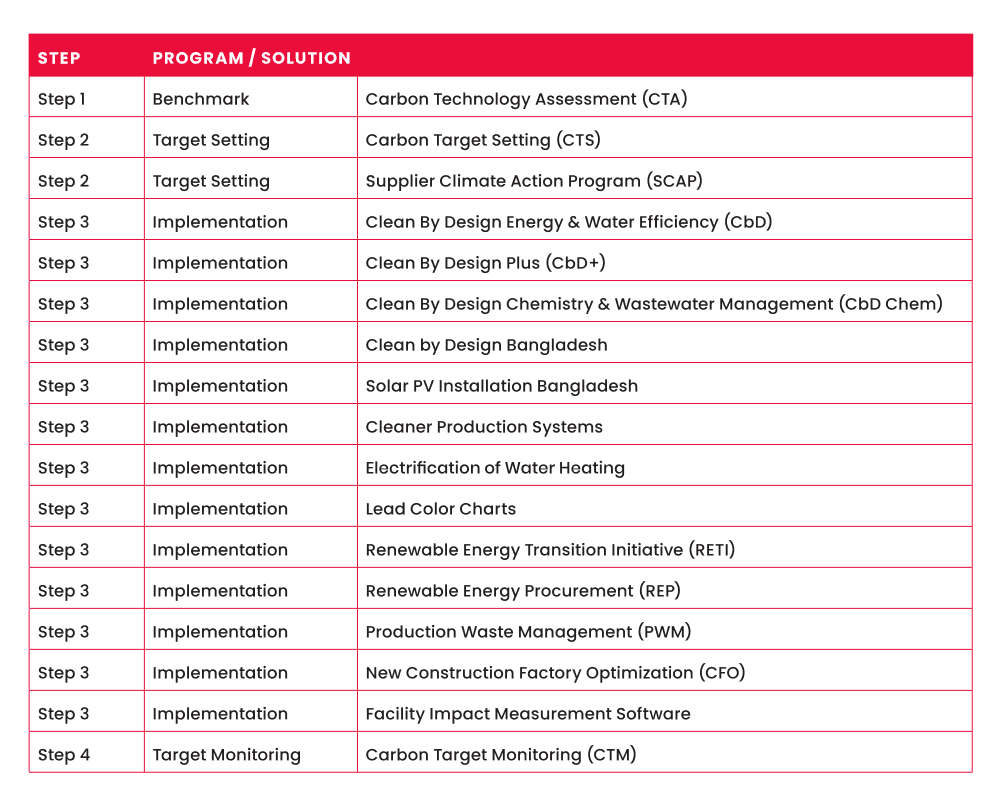
19 For more information about the programs and solutions, refer to “Our Programs and Processes” and “Climate Solutions Portfolio” in this report.
Methodology
Actual Cost Per tCO₂e (Total)
Total investment including contributions. For CSP solutions, this is total funding (Total GHG reduction x useful life).
Average % Reduction
The % reduction is calculated by dividing the reduction value by the baseline value for each metric. Therefore, the average % reduction is the average of the % reduction value from all the producers.
However, in some cases, it is not possible to calculate this value for a specific producer. For example, if no baseline is available (due to being out of the project scope, or because the first assessment was not possible).
In those cases, the producer will be excluded from the average calculation. Therefore, if in
a total of 50 producers, 2 do not possess the baseline values, the average will be calculated considering 48 producers.
Carbon Emission Unit
Aii’s carbon emissions data is measured in tonnes/metric tons (1000 kg).
Conversion Factors
Conversion factors are used to convert the original energy source units to a common unit. In the case of our programs that can have reductions in multiple sources (e.g., natural gas, electricity, biomass), we use the conversion factors to receive a single unit (megajoule or gigajoule), thus allowing to sum the reduction achieved. The same principle applies to the baseline. Aii is currently adopting the Conversion Factors provided by Higg FEM.
Emission Factors
The emission factors represent the greenhouse gas emissions associated with a specific activity or process. In the case of our programs, it represents the emission associated with the amount of energy consumed or reduced from a specific energy source. Aii is currently using a mix of emission factors, including Higg FEM, country-level grid electricity emission factors, and other country-level adjustments for some energy sources.
Sources Grid Electricity
Vietnam
Emission Factor 2021 until today: Official Document No. 1278/BĐKH-TTBVTOD, dated December 12, 2022, Department of Climate Change - MONRE
Emission Factor 2020: Official Document No. 1316/BĐKH-TTBVTOD, dated December 12, 2021, Department of Climate Change - MONRE
Emission Factor 2019: Official Document No. 116/BĐKH-TTBVTOD, dated December 26, 2021, Department of Climate Change - MONRE
Emission Factor 2020: Official Document No. 1316/BĐKH-TTBVTOD, dated December 12, 2021, Department of Climate Change - MONRE
Emission Factor 2019: Official Document No. 116/BĐKH-TTBVTOD, dated December 26, 2021, Department of Climate Change - MONRE
USA
Emission Factor 2022 until todayPakistan
Emission Factor 2021 until todayBangladesh:
Emission Factor 2020 until todayItaly
Emission Factor 2022 until todayEmission Factor 2021Emission Factor 2020Emission Factor 2019South Korea
Emission Factor 2022 until todayEmission Factor 2021Emission Factor 2020Emission Factor 2019Indonesia:
Emission Factor 2022 until todayEmission Factor 2021Emission Factor 2020Emission Factor 2019India
Emission Factor 2022 - todayEmission Factor 2021Emission Factor 2020Emission Factor 2019China
Emission Factor 2023 until todayEmission Factor 2022Emission Factor 2018-2021Sources Steam
China
SourceOther Countries:
EPA, Emission Factors for Greenhouse
Gas Inventories, 2022: www.epa.gov/ climateleadership/ghg-emission-factors-hub
IPCC Guideline for GHG Inventories 2006 revised in 2019
Gas Inventories, 2022: www.epa.gov/ climateleadership/ghg-emission-factors-hub
IPCC Guideline for GHG Inventories 2006 revised in 2019
Sources Biomass
China
www.ipcc-nggip.iges.or.jp/public/2006gl/Other Countries:
Resources Library – FEM 3.0 Resources & Archive – User Resources: How To HiggSources Biodiesel
China:
N/A
N/A
Other Countries:
Resources Library – FEM 3.0 Resources & Archive – User Resources: How To HiggSources Wood
China:
N/A
N/A
Other Countries:
Resources Library – FEM 3.0 Resources & Archive – User Resources: How To HiggGHG Reductions
We report the absolute GHG (greenhouse gas) reduction at the base year production level, rather than the GHG Intensity value. In the textile sector, the specific GHG emission, or the GHG emission per unit of production, is nearly an incomparable index due to the thousands of different types and qualities of products.
The factory’s absolute GHG reductions are the sum of all individual GHG reductions from each retrofit project implemented during the Aii project term.
The annual projected GHG reduction is calculated as follows:
Before starting programs at a participating producer, an expert conducts a baseline investigation of all energy uses from equipment or processes within the project’s scope.
There are two methods to calculate energy savings:
- 1. After implementing a program, the post-implementation energy use is measured. The difference between the baseline and the post-implementation measurements is annualized to determine the yearly energy reduction.
- 2. Energy savings can also be calculated directly based on the differences in key energy parameters, such as temperature.
GHG reductions are then calculated by multiplying the energy savings by the corresponding emission factor.
To calculate the GHG emissions reduction over the life of the project, the GHG emissions per year are forecasted over the useful life of the project, assuming no changes to GHG emission factors, no change in production volume, and annual degradation of the equipment efficiency in line with equipment specifications
To calculate the GHG emissions reduction over the life of the project, the GHG emissions per year are forecasted over the useful life of the project, assuming no changes to GHG emission factors, no change in production volume, and annual degradation of the equipment efficiency in line with equipment specifications
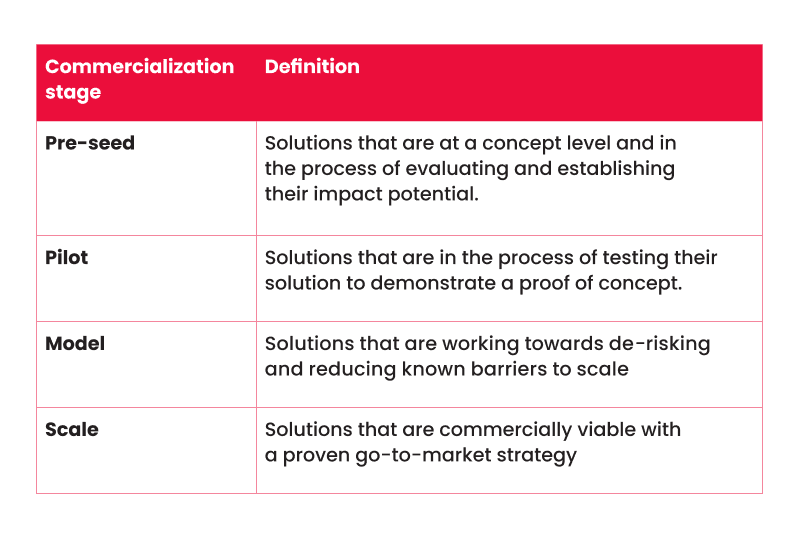
Pre-seed, Pilot, Model, Scale
Useful Life
Typically, a standard efficiency project remains effective for 10 years.
In the case of high-investment efficiency projects and renewable energy projects, we factor in a longer lifetime, ranging from 15 to 20 years. It’s important to note that the precise lifetime can vary, even for the same technology, depending on factors such as the choice of equipment brands at different producers.
For estimating the carbon reduction over the useful life of the investment, we assume a 3.5% annual decrease in savings to account for reduced efficiency of equipment over time (ie, year 2 is 96.5% of year 1 savings, year 3 is 96.5% of year 2 savings, etc.). For equipment with a 10-year useful life, the annual decrease in savings results in an effective useful life of 8.6 years. For CSP grant recipients, we assume the grantee, as subject experts, will devise their own useful life calculation with our consultation. While
we acknowledge these variations, for our calculations, we have made conservative assumptions, considering a standard lifetime of 10 years.


